Smart Money Dumping ETH While Retail Buys: The 7-Day Divergence
The Contrarian Read Everyone Gets Wrong
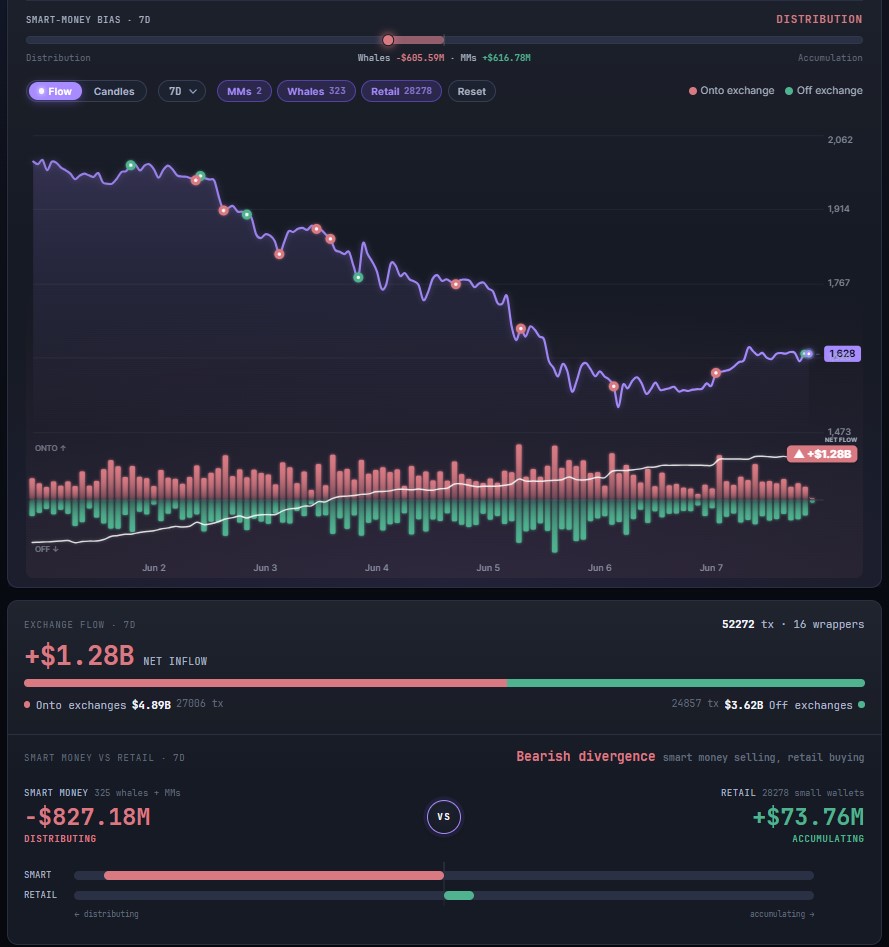
When ETH rallies 4.4% in 24 hours and exchange inflows run hot, the instinct is to call it accumulation. Capitulation over, smart money loading up, fresh buyers. But the Cexlens smart-money bias chart tells a very different story over the last seven days, and if you're sizing positions right now, you need to see it.
On the 7-day timeframe, the divergence is stark: whale portfolios (325 tracked addresses) are down $827.18M in net value through distribution, while retail wallets (28,278 small holders) have climbed $73.76M in accumulation. That's not a healthy signal. That's the exit pattern professionals execute when they want out before retail panic arrives.
What the Screenshot Actually Shows
The Cexlens smart-money bias detector (visible in the attached view) flags ETH as displaying a "bearish divergence" over 70 days. The price chart itself shows a hard decline from early June through mid-June, then a relief bounce to $1,628 (where it sits now). But underneath that bounce, the red outflow bars dominate the green: whales moving ETH off-exchange in volume, moving it onto Binance to dump, or moving it between wallets to prepare for distribution.
The distribution side is colored red and weighted heavily right - visual confirmation that professionals are reducing exposure. The accumulation side (green, left) is thin and pushed to the retail corner of the display. This is the opposite of a bottoming pattern. It's a topping one.
The Raw Flow Numbers Don't Lie
Zoom into yesterday's full 24-hour picture: ETH moved $486.27M in total flow volume across tracked transfers. That's 145 separate movements. But the split is telling: $198.96M came in, $287.32M went out. That's a $88.36M net outflow - on a day when price was climbing.
Price up, net outflow: classic distribution under a relief rally. The smart-money wallets are not the ones buying into that bounce; they're the ones who triggered the bounce by pulling liquidity, then dumped into it.
Binance absorbed the brunt: $437.05M inflow against $708.21M outflow for a net -$271.16M, processing 276 transfers in 24 hours. Smaller venues like Bybit ($0 in, $15.94M out) and OKX ($0 in, $11.26M out) show pure distribution patterns. No smart-money accumulation signal there either.
Why This Matters This Week
The bearish divergence tag isn't cosmetic. It means smart-money selling pressure is outpacing retail enthusiasm, even as price bounces. Historically, when whales distribute into a relief rally while small wallets accumulate, the bounce tends to be the gift - not the start of a sustained move. Retail gets the top tick.
The scale of whale distribution is not noise: $827.18M over seven days is a structural de-risking, not a tactical trim. And the timing - straddling a price relief into 4.4% gains - suggests professionals were selling the bounce they may have engineered via liquidity pulls.
Retail's $73.76M accumulation over the same period looks like the classic response: relief bounce hits news flow, small holders believe the narrative, step in to buy. Whales' exits are their exit. This is how you build a local top.
A single transfer exemplifies the pressure: $99.51M in ETH moved onto Binance from wallet 0x3304…566a on Base chain. That's a classic whale preparation for sale or hedging. You can track that exact movement and its historical context via Cexlens' wallet analytics for that address, which shows its full accumulation and distribution history - and this one sits firmly on the distribution side of the ledger.
The Real Signal
Don't mistake a 4.4% bounce for a reversal. The smart-money bias chart is shouting that professionals remain net distributors into any relief. Until the red distribution bars shrink and the green accumulation bars widen, the structure remains bearish. Retail is buying the rumor; whales are selling the news.
If you want to monitor this divergence live as it develops, Cexlens' flow scanner lets you filter ETH inflows and outflows by exchange and whale tagging in real time. Watch for the day when whale distribution flips to accumulation - that's a structural signal shift. We're not there yet.
The bounce was real. The distribution underneath it was realer.